Step 3: Add Your Synthetic Data to the Risk Pool Structuring tool
Once the loss data has been compiled for each ‘risk’ (hazard and country combination of loss data), it can be added to the Risk Pool Structuring Tool, to examine the different risk pool options and what predictable funding this could provide for the different risks.
Guidance for using the Risk Pool Structuring tool
Open the Risk Pool Structuring tool and select “Country 1 Data Input.” Any cell highlighted in yellow is to be edited. If using a previously used version of the tool, the user should carefully check all entries to make sure the parameters are relevant to the current analysis.
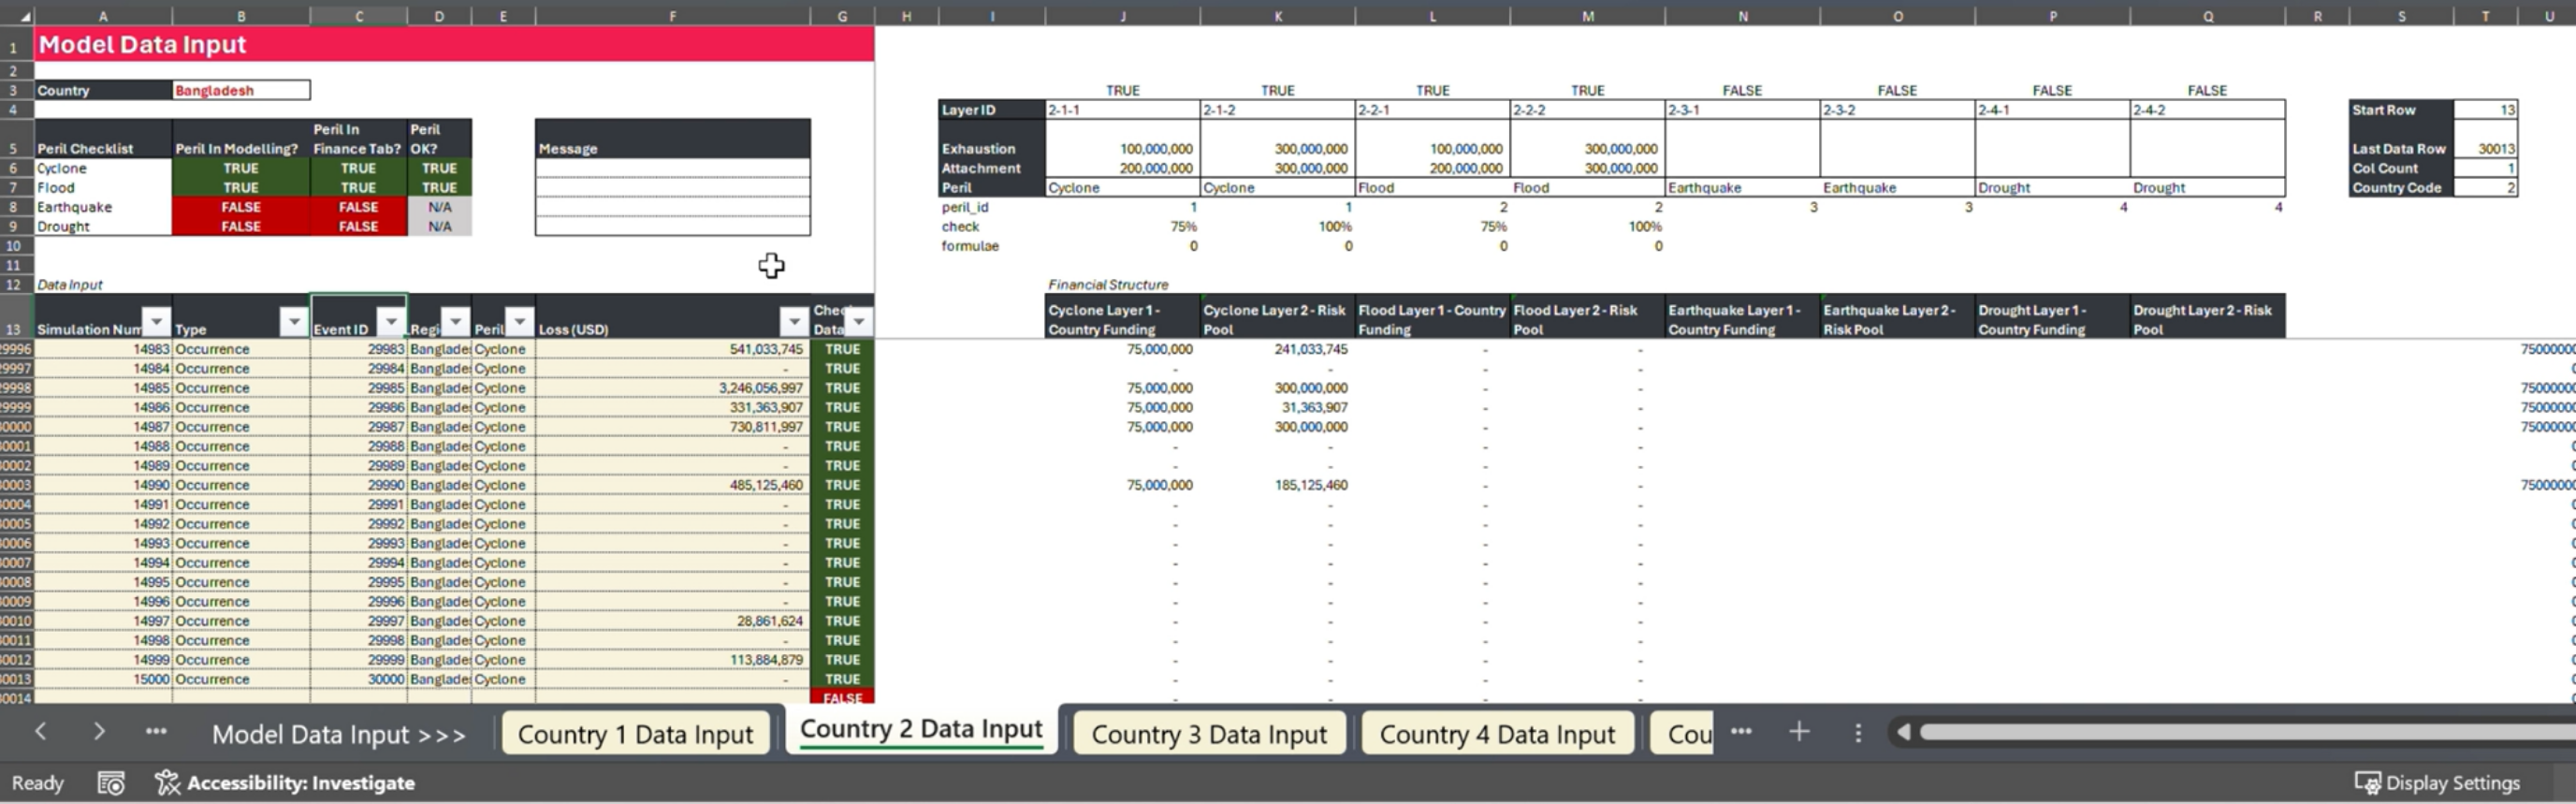
Country data input - repeat for all countries you are including in the pool (Click to enlarge image)
Paste in the columns from your downloaded synthetic CSV for your first country event and simulated data set with the headers: Simulation, Type, Event ID, Region, Peril, and Financial Loss (USD)
Check for Errors: Column G indicates True/False if any mismatch or missing data is found. Table A5 to D9 checks True/False errors on the peril information and type. Correct any issues, then re-upload if necessary.
After successful upload, the Risk Pool Structuring tool automatically generates various loss scenarios using the new data.
Repeat this step for all of your country data sheets to upload them to the subsequent Country data input tabs. Remember you can only add in one catalog per country risk.
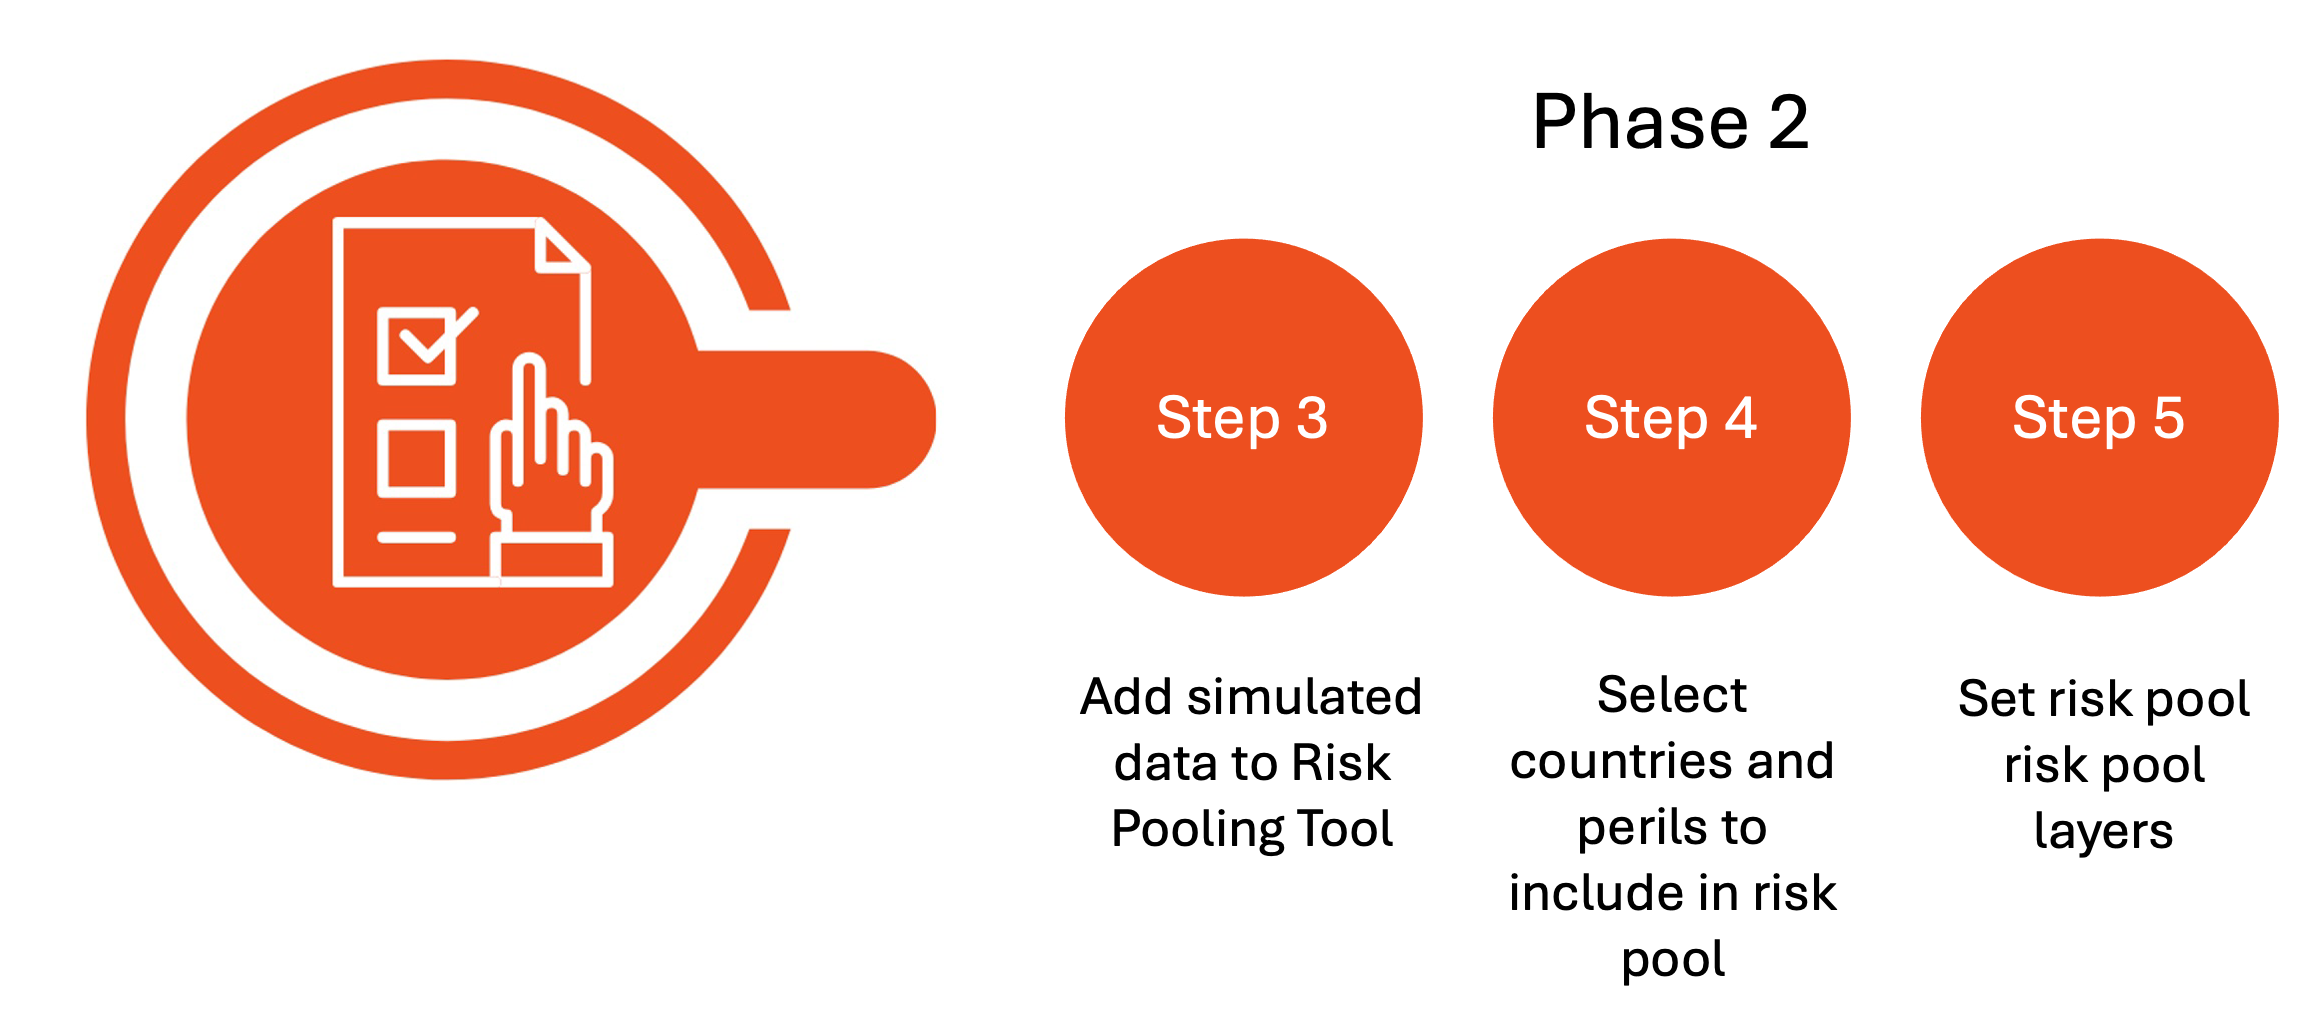
The tool has now been primed with the knowledge of the shape and nature of the risks that will be within our risk pool. You’re now ready to move on to Phase 2: Setting up financing triggers and thresholds against these risk estimates.
Step 4: Select the Countries and Risks to Include
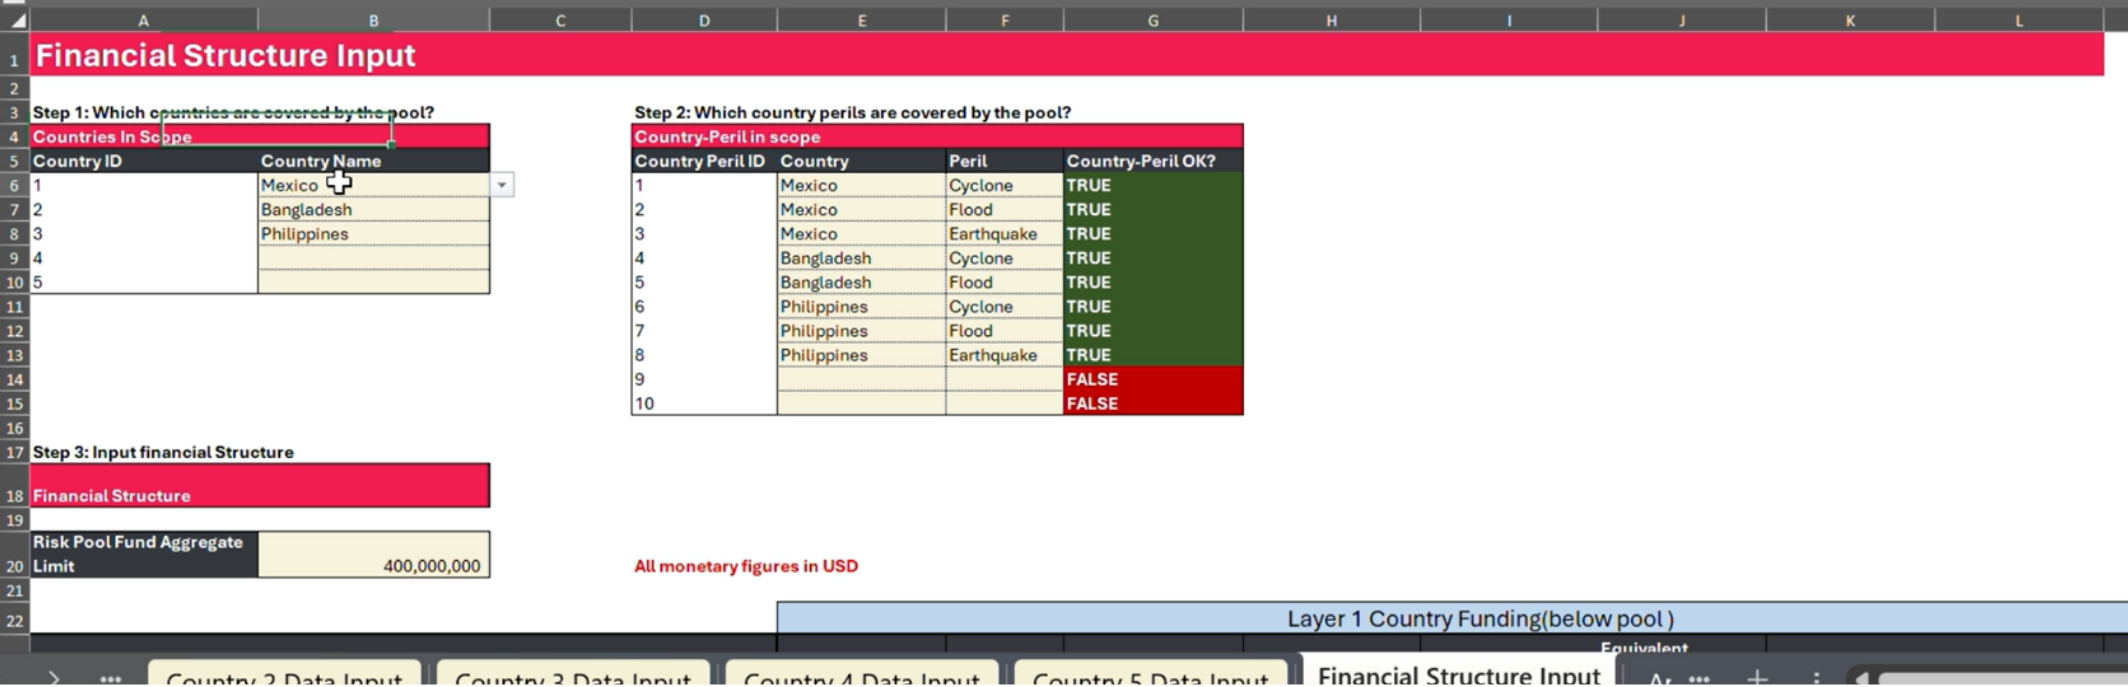
In the Risk Pool Structuring tool go to “Financial Structure Input” Tab
List the countries to be included in your risk pool in the table in cells B6 to B10. The Risk Pool Structuring tool enables you to include up to five countries and four hazards (cyclone, flood, drought and earthquake). In the table in cells E6 to F15 you will now have those countries available in the drop down menu in column E.
Now select the hazards (perils) from your catalogue that you want to cover in that country. These will show up in the structuring table in cells in A23 and B23.
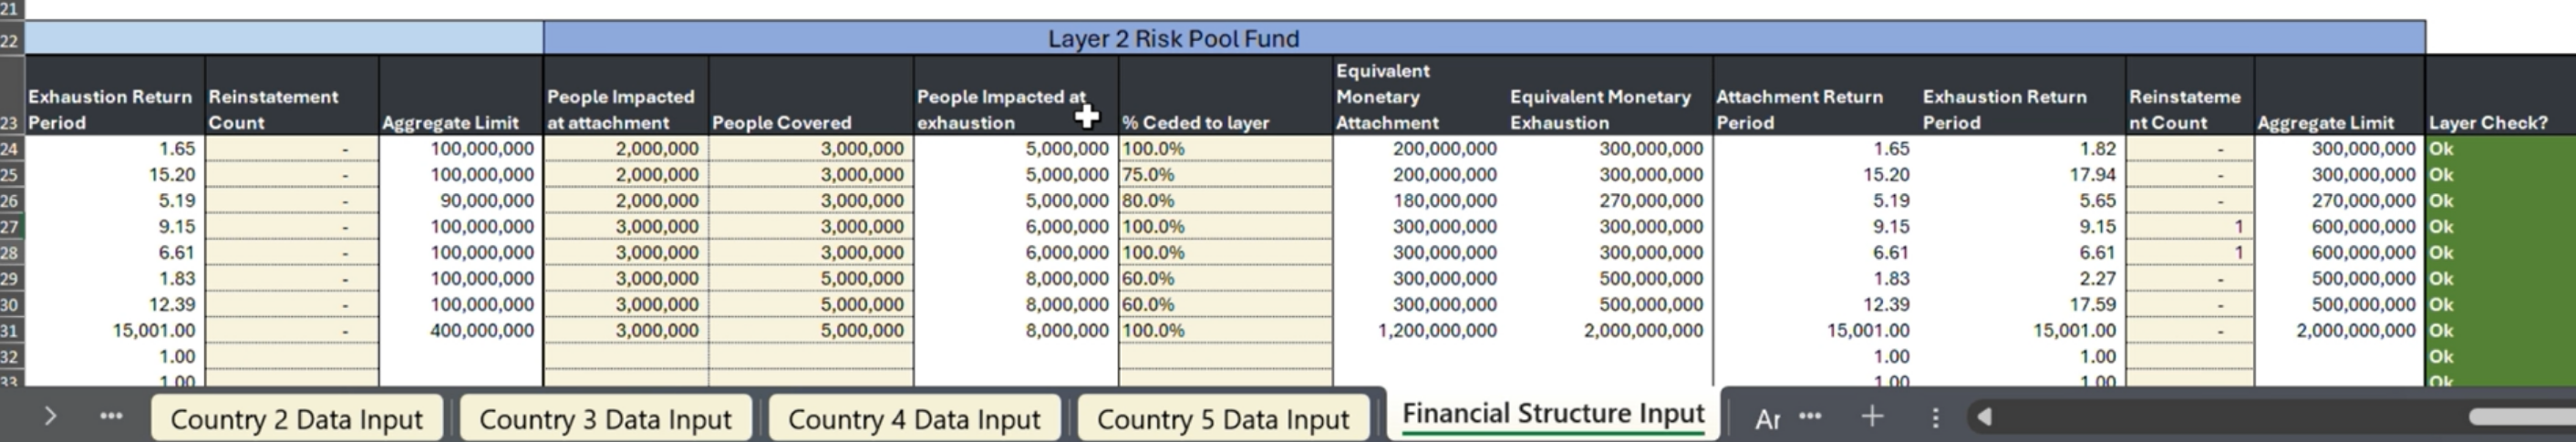
Financial Structure Input (Click to enlarge image)
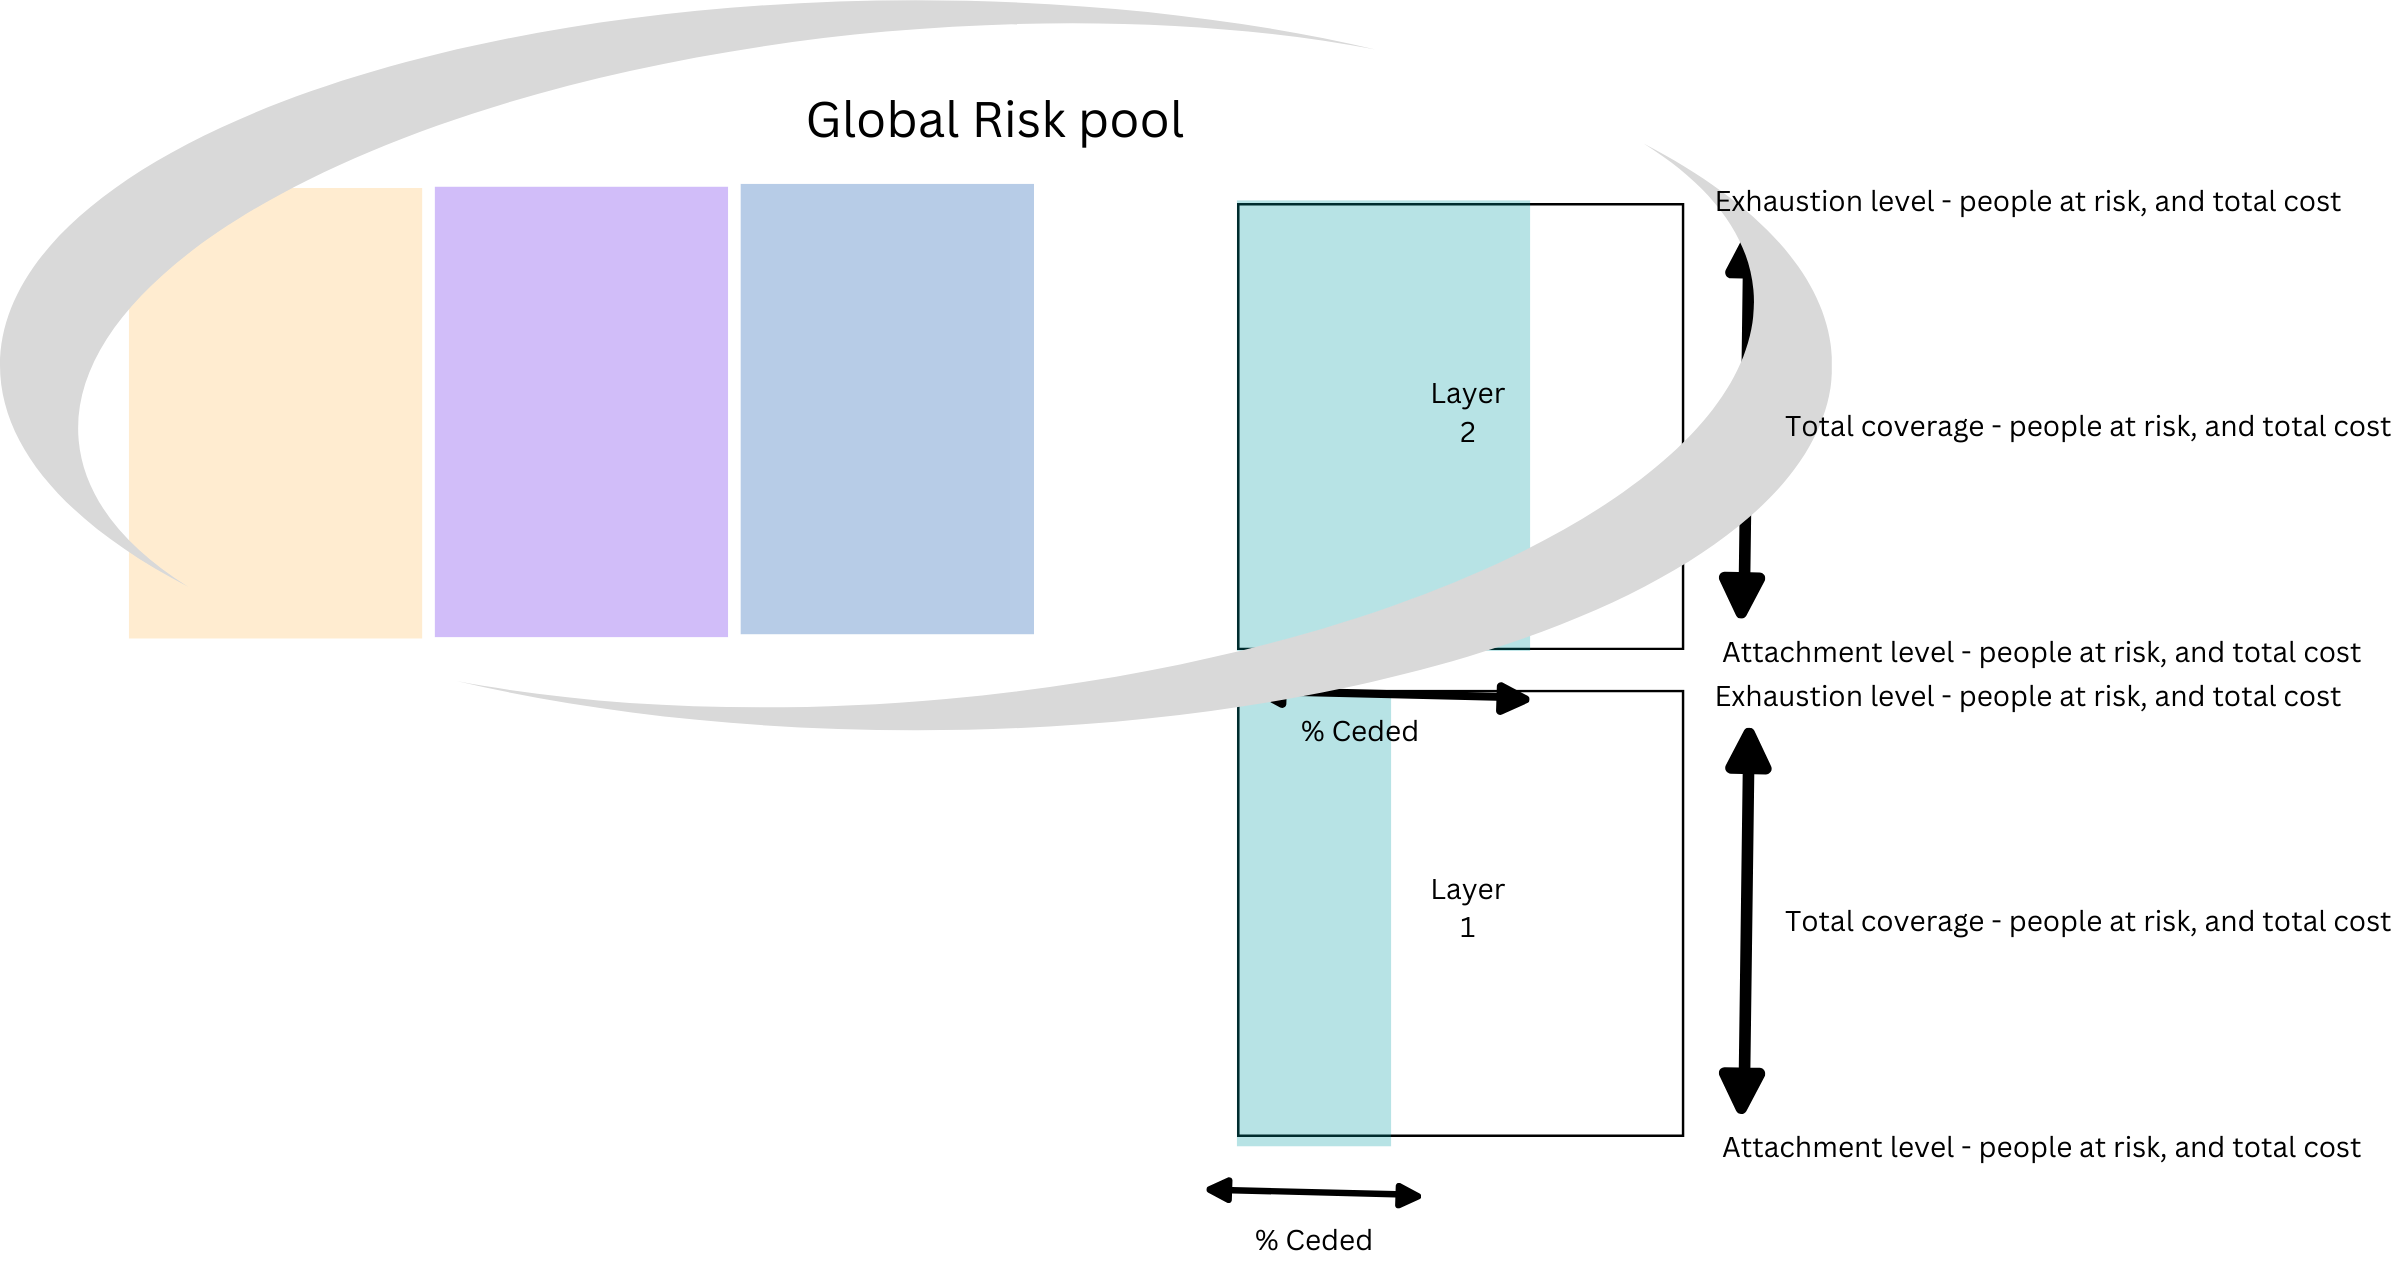
The Risk Pool Structuring tool offers the opportunity to consider layering funding for the risk. This means identifying two financing lines for different severity events or types of actions:
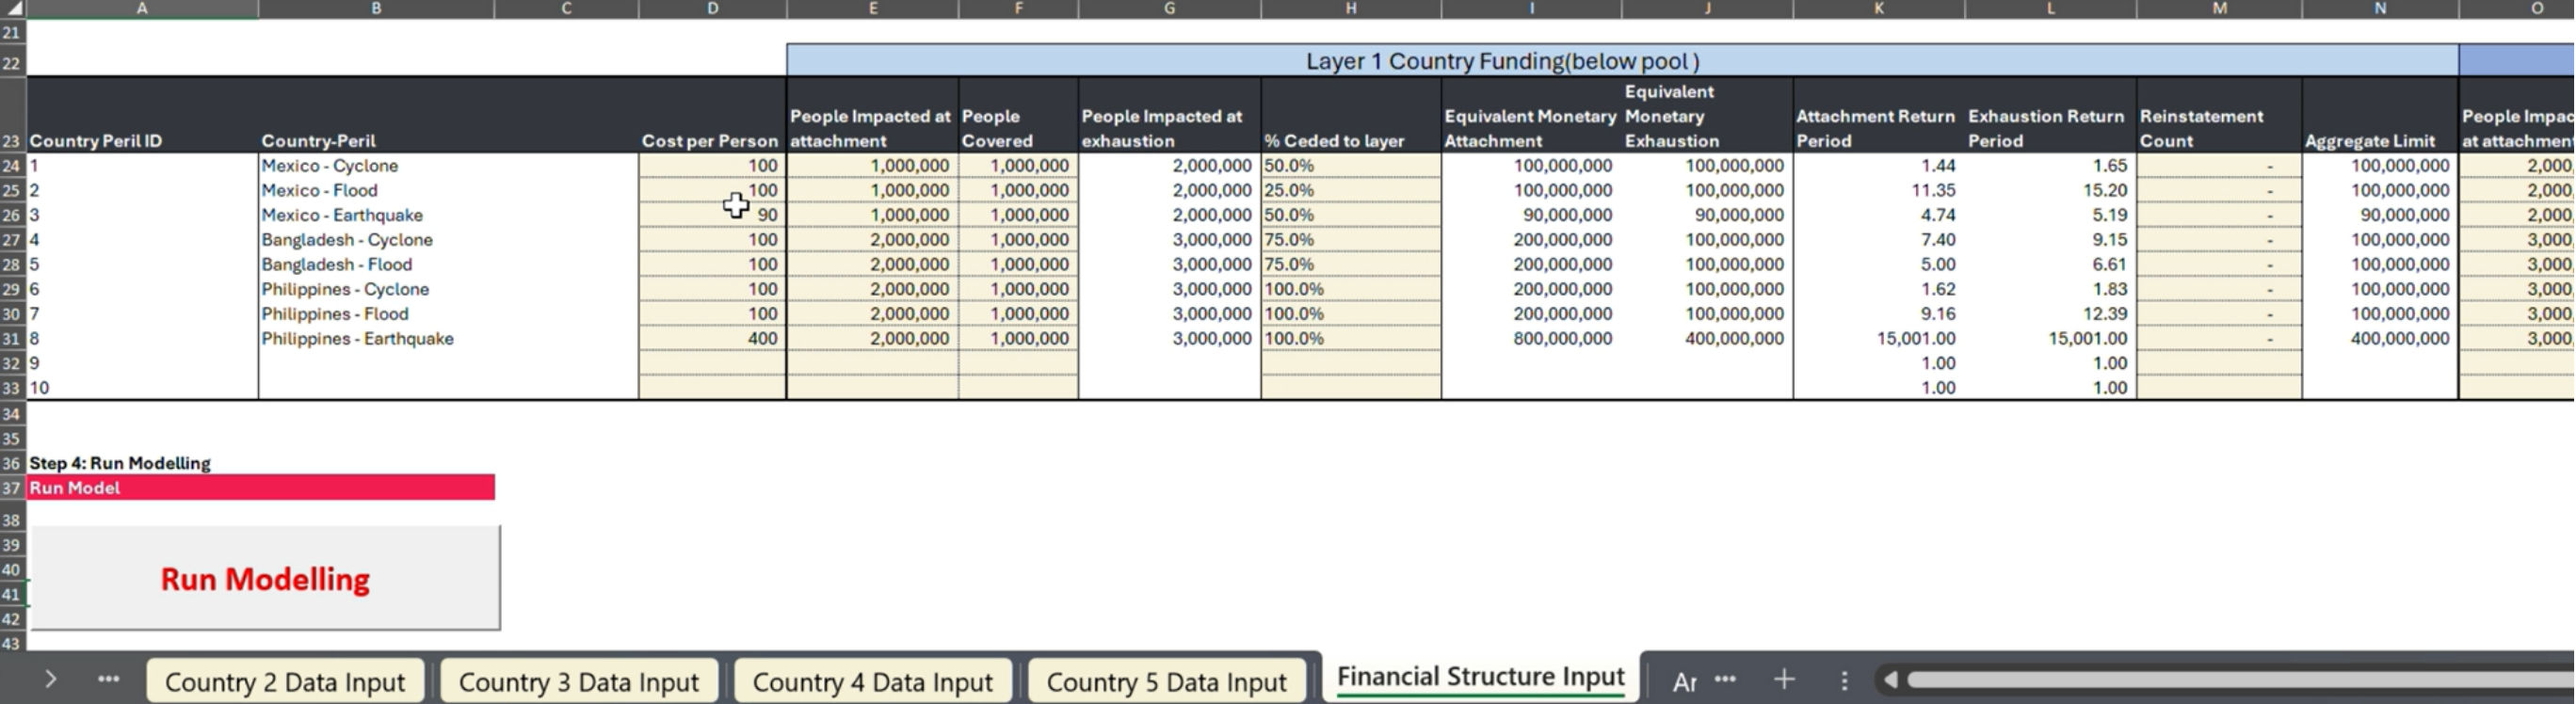
Layer 1 is funding that is perhaps covered by national or local budgets or ‘reserve funding’. This may be where you might assume that more sub-national, localised, and individual resources would come into play, and so wouldn’t need emergency coverage. Having knowledge of what this level might look like is important to think carefully about those attachment points and when the need for emergency financing may come into play. You may also want to consider in the very worst crisis what your gap in funding might be. It could also be called a deductible or excess in some cases, and accounts for any funding to cover the risk not coming from your pool. Layer 1: Local/national coverage or a “deductible.” Input values into Cells E24 to L33.
Layer 2 describes the coverage you want to include in your risk pool. Input values into Cells M24 to T33.
The remaining parameters apply to both layer 1 and Layer 2.
The value for ‘Average cost of payout per person’ is used to determine a trigger based on number of people affected. This value should match the value of response cost per person applied in the input data, e.g., in the Loss Simulator tool.
Define the average cost per person you are considering in your payouts in cells D24 to D33. This may be specific to each country and risk. There are a few ways you might arrive at this value:
Use historical loss data and the numbers of people impacted, taking a simple average cost per person. This approach is often used by the insurance industry and development banks (note this may also be a limitation of the input data). The drawback with this is that the cost of a crisis is likely to be only what was available to be spent, not necessarily what was needed.
Use proxy metrics such as social protection payment methods or cost of dietary requirements. The country may have an established budget per person or household method for different kinds of crisis. This approach is often used in micro- and meso-level insurance schemes.
Create the cost per person using planning and delivery scenarios. Using the loss catalogues to set quantitative scenarios, and emergency plans including delivery needs and volumes for the communities and people at risk, a cost per person average budget could be estimated. The Start Ready approach is useful for sovereign risk financing and disaster operations planning.
Controlling the taps
Imagine our layers as big tanks of water with many pipes and taps running off them. To make sure we don’t drain the tank and not have available water (funding) for when we really need it, we have to put some limits on the use of the taps and how and when they can draw water (funding) from the tank. This is how we set the financing structure.
3.1. Attachment Point (“trigger”) - the threshold number of people impacted to trigger funding (cells E24 to E33):
The severity (e.g., 1-in-5-year event; or an event with a 20% probability of occurring in any given year) at which a specific number of people are at risk and the funding layer begins paying out (when we can turn that tap on). This could also be called a trigger point or threshold. It is depicted in the form of a return period value with an associated number of people impacted and financial requirement.
Using the cost per person and the number of people the tool automatically generates the return period event level and financial level this relates to. This is automatically generated in column I.
3.2. The number of people covered (Cells F24 to F33): Here you can input the number of people at risk you would want to be covered by the funding. This will automatically generate the top of your coverage for that layer in column J - Equivalent monetary cost at Exhaustion.
3.3. Exhaustion Point (“cap”) (automatically generated): The point at which this layer stops paying (when the tap needs to be turned off), where another layer or additional coverage might start. This could also be a cap or limit on when that layer of funding will be exhausted. For example, perhaps you have a national fund that covers layer 1, but you know you will never have more than $1 million to payout from that fund for that risk; the layer exhausts when that $1 million is spent.
3.4. Percentage ceded to the layer: Each layer of risk will hold a total financial value, numbers of people at risk and equivalent monetary values, for the totality of the risk in that layer. This related to the return period of that disaster loss. But the whole of the risk may not be all of your burden to cover. It is likely that each of those layers of risk will have multiple actors and financing lines responding in such scenarios and in this case you may not need to have financial coverage for the whole layer. If this is the case you would need to define the share (as a percent value) of that layer you are covering in layer 1 and 2. This is another lever in which to increase or decrease your financial liability. You could think of it as how wide your pipe or tap is.
3.5. Reinstatement count: How many times the full coverage can trigger in one year assuming full replenishment of funds each time (think of it as how often we can turn the tap on and off in one year for a stated amount of water to flow). This refers to the number of times in a year the attachment or trigger will reset and allow for another payout. For example, you may allow for three full disbursement due to flood triggers in one year but no more after that. You have to limit how many times the tap can be used; otherwise, you may drain all the tanks at one time.
3.6. Aggregate Limit: This is the total potential amount of funding accounting for attachments, exhaustion and reinstatements that the layer could be liable for in any one year. So, the total potential amount of water in the tank that would need to be available in the very worst case for that tap/risk (assuming the water gets replenished, per the reinstatement count).
The magnitude frequency relationship can sometimes be displayed as a return period, also known as a recurrence interval or repeat interval. It is the average time or an estimated average time between events of the same magnitude. Impact metrics such as people at risk, losses, costs or alike linked to the hazard magnitude can also be displayed as return periods of those occurrences.
When an event occurs or is forecasted to in some cases, all of the funding of that magnitude and below gets activated to begin flowing from the taps. When the prepositioned funding runs out in layer 1 through the taps, and we enter the layer two magnitude zone, then layer 2 taps start working up until the triggered level, and so on and so on.
The clever bit with risk sharing in a pool is that you are able to combine many different risks and multiply the probabilities of occurrence. Different country risks can be held together and the funding flow between in our global risk pool.
Fundamental Principal
When you combine and multiply probabilities, the overall probability goes down - this is what risk pooling takes advantage of - sharing risk.
This means we can be much more efficient and not allow money to sit around waiting for a trigger, or one that very rarely happens but still allows funding guarantees to be met, when the event occurs and hits attachment point. This kind of mechanism is also sometimes called a co-operative model. We will get to this more on the pool analysis tab.